
You were doing what? Here’s what a ridiculously detailed time study says about the US
14 août 2023
9min

Journalist and translator based in Paris, France.
Which of your children woke up first yesterday? Did you do any activities that you’ll be paid for? At 4am, what were you doing? Who was with you? What did you do next?
These are just a few of the questions participants in the latest American Time Use Survey (ATUS) were asked so that the Bureau of Labor Statistics could chronicle everything from how long their commute lasts to how much quality time they spend with loved ones. By focusing on the minutiae of a sample of American lives, the ATUS allows us to better understand how society works. This year’s results help to show the effects of working from home (WFH) on families and society. They also reveal levels of loneliness, how much time is spent looking at screens and the factors behind gender wage and household chore gaps.
This is no small endeavor. Nationally representative sample cases for the survey are selected monthly, and interviews are conducted throughout the year. In 2022, about 8,100 individuals were interviewed to provide this year’s results, which were published in June. Since 2003, when the survey was first introduced, almost 237,000 interviews have been conducted.
To help you – and us – to gain an understanding as to why government economists care how much time we spend cooking dinner or watching Netflix, Welcome to the Jungle spoke to Victoria Vernon, associate professor of economics at Empire State College at the State University of New York, who works closely with the ATUS in her research.
How does the American Time Use Survey work?
There is a giant survey conducted in the United States called the Current Population Survey [CPS]. People participate in that survey twice (first for 4 months, then 8 months off, then 4 months again), and then, at the end of the survey, a small share of the households are selected to participate in the ATUS. One person from these selected households is told ahead of time that they will be asked recall their minute-by-minute activities on the day before the interview. That could be someone from age 15 to 100.
The ATUS first came out in 2003. And now we have new data every year, with between 8,000 to 20,000 diaries per year. The idea is to get a better picture of how Americans spend their time on various activities.
This is the only large diary data that’s available in the United States. There’s some time-use information available in other datasets, such as PSID, but this is the only diary — the whole day, 24 hours — that’s available to researchers for each year. Other surveys have recall data, like, “How much time do you usually spend on housework per week?” or, “How much time did you spend last week on work?” But this one is minute by minute. So we know when and where stuff is taking place.
Why does the Bureau of Labor Statistics sponsor such a broad survey? What do all these questions have to do with work?
The US Bureau of Labor Statistics [BLS] jointly with the US Census Bureau are in charge of the Current Population Survey, and ATUS is an offshoot of that survey, [which is] the main source of employment information in the United States. So all those employment numbers you hear on the radio, on TV, in the media, they’re computed based on the Current Population Survey.
The BLS deals with all questions related to work. How many hours do people in various industries work per week? How much money do they earn? Who is laid off or unemployed for a long time? The ATUS allows us to drill down into specifics: When and where do people work? What do they do if they don’t work, or on days they don’t work? How much work-related travel is going on?
Some years, the ATUS has extra modules. For example, health and wellbeing. How happy did people feel during three randomly selected activities during the day? How much did they enjoy their commute on a scale of 0 to 6? That’s how we know which activities people like and don’t like. Or, in “econspeak,” which activities people derive utility from — or disutility. A lot of happiness studies have been based on the American Time Use Survey.
There are also drawbacks to this survey. Ideally, you want to see more than one person’s schedule in each family. If you have a husband and wife, for example, you could see important things about their allocation of work. Do they share chores? Do they share childcare? Who is taking care of the child, and when? Do they coordinate work schedules? Understanding the division of work within a family is important for policy. If women bear the burden of housework, eldercare and childcare, it may explain, in part, why they may devote less time to paid work, and therefore earn less than men. So this could be important information to have, but we can only infer it from the ATUS.
The diary is just one day. Ideally, for a researcher, we’d want at least two different days this year and a year later for the same person. Better yet, it would have the same people tracked several times over time. That would be the best. Then you could see if someone’s job changed or went remote, and how their specific time use changed.
Why did the Bureau of Labor Statistics decide it needed information on what people do in their day?
It is important — for example, for transportation. There are public policy implications that might result from [knowing] when people are on the road, or what time people are taking care of their children. So, at what time of day should certain public services be available? It gives this whole giant amount of information available for researching a variety of questions, like: Should schools start earlier? When do people sleep? How much do they sleep? Do they get enough sleep? Sleep is important because it affects your focus, your productivity.
Also, we want to be able to measure how much unpaid work is taking place. When you take your child to daycare, buy a takeout meal or pay a locksmith to repair your lock, the amount you pay for these services is included in GDP [gross domestic product figures]. But if you provide the same services yourself — take care of your child, cook a meal for your family and fix your own lock — their value is not included in GDP. We want to measure unpaid work to get a better idea of how much value we create not only at work, but also at home. Just think how much unpaid work is done by parents raising a child. All that work is, to some extent, public service because parents use their own time and money to raise a future taxpayer who will pay for the retirement of people who don’t have children.
Does this information affect things like hybrid work, or how companies organize their schedules?
Yeah. There are other surveys where they survey companies and specifically ask them questions about how many employees they have, what is their schedule, how many are remote, and so on. But with the ATUS, we have people’s point of view. For the working-age population – 18 to 65 – we know their schedule. We don’t know why they’re working this particular schedule, but we can see that they’re working from home, and that maybe they tend to work more in the evenings. So when people have freedom and flexibility, we can see when they end up working.
What stands out the most about this year’s ATUS?
That’s a hard question, because if you were to look at all the tables and questions, it’ll boggle your mind how much information is in there. Does people’s time-use change over time a lot? It doesn’t, unless something drastic happens like the pandemic, which reduced travel and made big changes in childcare.
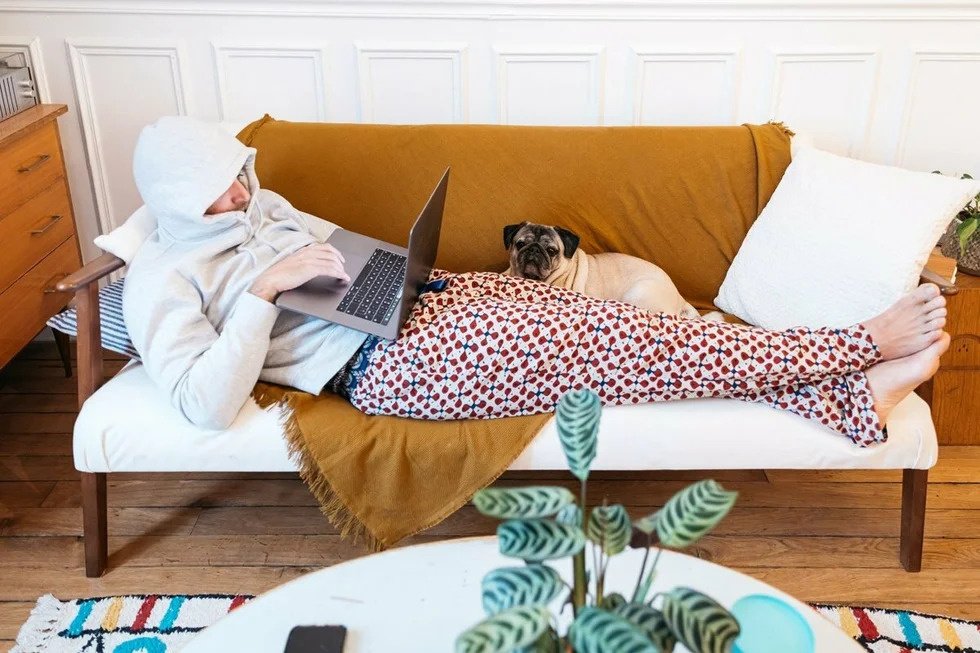
These are the categories we’d look at — what else would be a candidate for drastic changes? Work from home is one of them. This year’s survey shows that 34% of employed persons do some work at home [based] on the days they worked in 2022, down from 38% percent in 2021. No surprise, as some employers began a return-to-office policy, or shifted from full-remote to hybrid schedules. However, a larger share of workers were working at home in 2022 than in 2019, before the pandemic.
Work is one third of our day. One third of our time-use is sleeping, and one third is spent on something else. So, If you don’t expect any giant changes in sleeping, then it’s work that’s the most important part of our day. And it’s work from home that’s revolutionizing the workplace. Well, other than AI — and I wonder how we’re going to see that in the upcoming years. It might show up as less time spent on certain tasks, or we may see direct changes in the composition of jobs.
Do you think working from home is here to say?
Yes, absolutely, it’s here to stay. And people will be able to select themselves into the remote and non-remote groups based on their own perceived productivity.
So, where are they most productive? Those who think they do their job better at home will work at home, but those who think they’re more productive in the office will be willing to work there. And they should have that option. Otherwise, for younger employees, they might be lonely at home playing games, right? A huge amount of time is spent on gaming. These people might work better or be more successful if they went into the office.
Did anything else stick out to you in this year’s survey?
Time spent gaming among boys and young men. Last year, teenage male gamers spent three hours and 40 minutes of a typical day gaming on average [according to the information collected as part of the survey but not shared in the published results]. And 52% of teenage boys played games on a given day — that’s up from 39% before the pandemic. The share of gamers increased among girls too – from 6.5% to 18% – with an average gamer spending two hours and 17 minutes a day in front of the screen. Gaming increased among men aged 20 to 29 as well, from 18% to 28%. For comparison, only 3% of females in this age group are gamers.
Do you think that could impact the workplace?
If I were an employer, I would be worried that young, potential employees are spending that much time gaming. I’d want to know they’re not doing it during work hours. Only 9% of men in their twenties play computer games between 9am and 5pm on a workday, but that’s an increase from 3% since last year.
What else stood out from this year’s results?
The trend in the time people spend alone. You can see that all age groups still spend more of their awake time alone than before Covid – it never fully returned to normal.
For some age groups, the difference is huge. For working-age adults, this is explained entirely by remote work, because their off-work hours did return to normal. But for teens, there is no explanation. In 2019, the average time a teenage boy spent alone was 281 minutes, and in 2022 it’s at 346. That’s an hour difference. And girls are at 51 minutes. That could be a useful metric for public health and figuring out how happy people are, because time alone is linked to poorer mental health.
What are some findings you’ve made in your previous research based on the ATUS’ data?
Together with my co-author, Sabrina Pabilonia from the BLS, we studied the time allocation of dual-earner couples with young children during the pandemic. We showed that, during the pandemic, the switch to working from home didn’t cause parents to reduce their paid work hours. Fathers who worked from home helped out more with chores and childcare, decreasing the gender chore and caregiving gap. But mothers still worked fewer paid hours than fathers did, regardless of where they were working.
This mother-father gap in paid hours actually decreased during the pandemic – but it’s partially because some mothers exited the labor force. We found that mothers who work from home were more likely to spread their working hours throughout the day, with breaks in between work episodes, and to work in the evening when their children may have been sleeping. These potential disruptions in mothers’ working time could have negatively affected their productivity in paid work and contributed to the exit of mothers from the labor force.
But during this period many schools were closed and summer camps were not available. Now, we are in “normal times” but in a new world, one that embraces remote work, and it is wonderful. We expect that the availability of remote jobs will increase labor force participation among women with young children. It will be interesting to see how mothers’ total work has changed in 2022, and whether fathers kept the habit of doing more chores in these post-pandemic times.
Dr Pabilonia and I are planning to update this study on how parents allocate time to paid work, chores, and childcare based on their joint working arrangements. We’re interested to see if these gender gaps are decreasing due to remote work or not.
What other projects will you be working on with the ATUS data this year?
I have started a project looking at adult students and how they spend their time. “Adult students” means they’re enrolled in college but they’re over the age of 25. So, when you’re getting a master’s or bachelor’s degree, where does the time come from? What do you reduce? And in my previous work, I found that they mostly reduce watching TV. We spend, as a country, a huge amount of time watching TV. A typical young person aged 15 to 49 spends two hours a day watching TV. That includes Netflix, YouTube and other streaming platforms. Older people, aged 65 and up, spend more than four hours a day in front of the TV. That’s huge, and not all of it is that useful, right? I watched Black Mirror last night, and one of the episodes wasn’t that good at all. I thought it was time wasted.
Photo: Welcome to the Jungle
Follow Welcome to the Jungle on Facebook on LinkedIn and on Instagram and subscribe to our newsletter to get our latest articles every day!
Inspirez-vous davantage sur : Les tendances du monde du travail
Why are workers quitting after getting promoted?
29% of promoted employees quit within six months of their promotion—but why?
13 mars 2024

Overemployment: Reinventing moonlighting in the digital age
Read personal stories from those juggling multiple roles, and expert insights on the trend from a future of work strategist.
29 janv. 2024

7 things that will happen at work this year
What's in store for the world of work this year? These 7 expert predictions...
24 janv. 2024

From affirmative action to teenage work injuries: Your July working-world recap
Check out our monthly recap and stay updated on the latest news and buzz in the world of work
01 août 2023
WFH parents suffer and Bill Gates says to take a break: Your May working-world recap
Our monthly report keeps you updated on the latest stats and buzz of the working world
06 juin 2023
La newsletter qui fait le taf
Envie de ne louper aucun de nos articles ? Une fois par semaine, des histoires, des jobs et des conseils dans votre boite mail.

Vous êtes à la recherche d’une nouvelle opportunité ?
Plus de 200 000 candidats ont trouvé un emploi sur Welcome to the Jungle.
Explorer les jobs